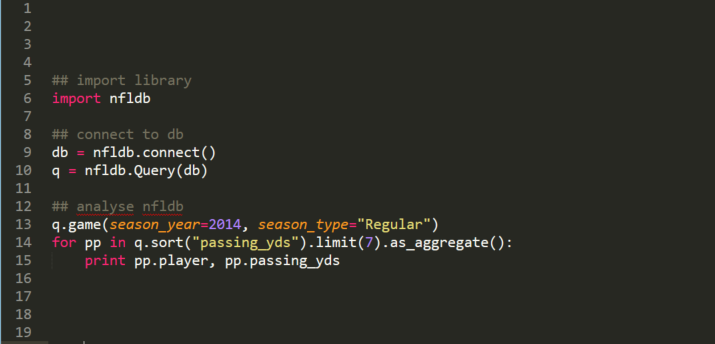
So, just a few days ago I posted Learning Club 00: Set up your development environment (Getting started with R). There I made a mistake and decided to use R without thinking about the data set I would use. I am still happy I wrote the post because it can give all the R users … Continue reading Learning Club 00.b: Setup your development environment (Get started with python package nfldb)
Category: Data Science
Data Science related stuff like collecting data, statistical methods, machine learning, … Mostly #rstats
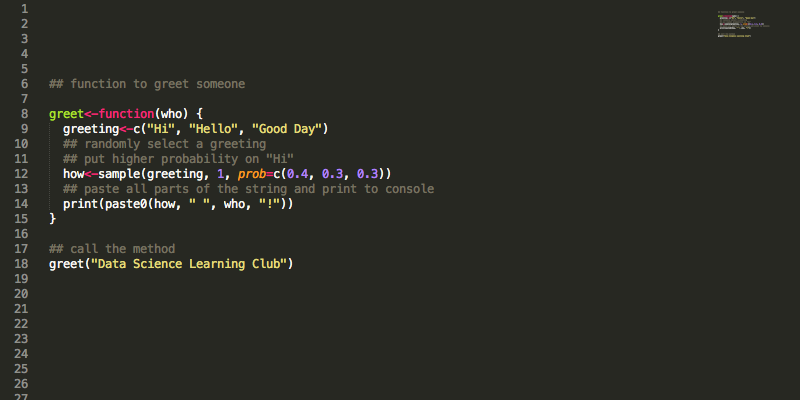
Learning Club 00: Set up your development environment (Getting started with R)
A few weeks ago I became aware of Renee’s (owner of the blog Becoming a data scientist) plan to start a data science learning club and I thought it was a cool idea. In the learning club she will post activities and the first one was about setting up your development environment: Activity 00: Set … Continue reading Learning Club 00: Set up your development environment (Getting started with R)
[Howto] Using Google URL builder, Google Analytics and R to create trackable QR codes
Some time ago I needed a QR code for a project and also wanted to find out how many people used that QR code. Googling returns many, many options, too many in my opinion. Each web site has different features, some provide counters, every web site has different data types you can export (from bad … Continue reading [Howto] Using Google URL builder, Google Analytics and R to create trackable QR codes
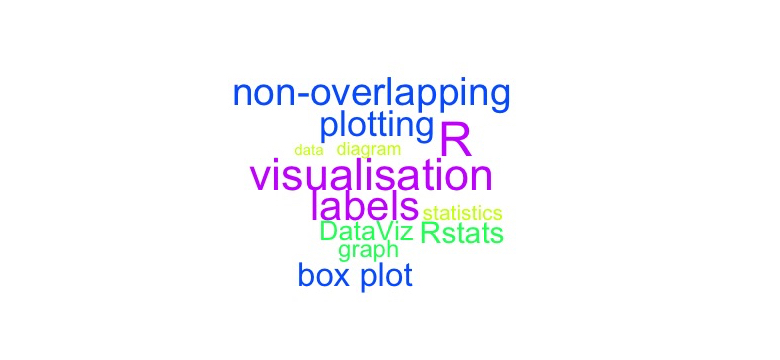
Add non-overlapping labels to a plot using {wordcloud} in R
Several times when I create a plot I want to add labels for some dots directly on the plot. For this purpose I have looked for a solution to do this, because implementing it with text would probably take a lot of work. Luckily I found this two links: [stackoverflow] How do I avoid overlapping … Continue reading Add non-overlapping labels to a plot using {wordcloud} in R
what3words in R: threewords V0.1.0 and my own language extension
Recently I scrolled through the list of recently published R packages when something caught my eye: threewords: Represent Precise Coordinates in Three Words which sounded interesting. What is what3words? The about page of their website explains it very well. what3words is an alternative to represent coordinates using exactly three words (instead of GPS coordinates for … Continue reading what3words in R: threewords V0.1.0 and my own language extension
Statistical tests: One sample t-test in R
This is the second post about statistical testing. In the first one I explained the principal concept behind statistical tests. Parametric tests are, in contrast to non-parametric tests, statistical tests that make some kind of assumption about the data. In general parametric tests are used when we assume normality for the source population of our … Continue reading Statistical tests: One sample t-test in R
Debugging in R
During the past few months I have used R and RStudio a lot and since I have implemented some functions that also other people use I found it very useful to know how to debug in R. Debugging is not as convenient or comfortable as in Visual Studio but you can make your life a … Continue reading Debugging in R
Statistical testing: An introduction
I am planning to write about parametric and non-parametric testing but since I know that many people have difficulties with the concept of hypothesis testing itself, I am going to give an introduction to the basic concepts first without immediately trying to frighten you. In general, a statistical test consists of four steps: Formulate the … Continue reading Statistical testing: An introduction
[Dimensionality Reduction #2] Understanding Factor Analysis using R
This time I am going to show you how to perform Factor analysis. In the next post I will show you some scaling and projection methods. The idea for this mini-series was inspired by a Machine Learning (Unsupervised) lecture I had at university. I will perform all this methods on the same data sets and … Continue reading [Dimensionality Reduction #2] Understanding Factor Analysis using R
[Dimensionality Reduction #1] Understanding PCA and ICA using R
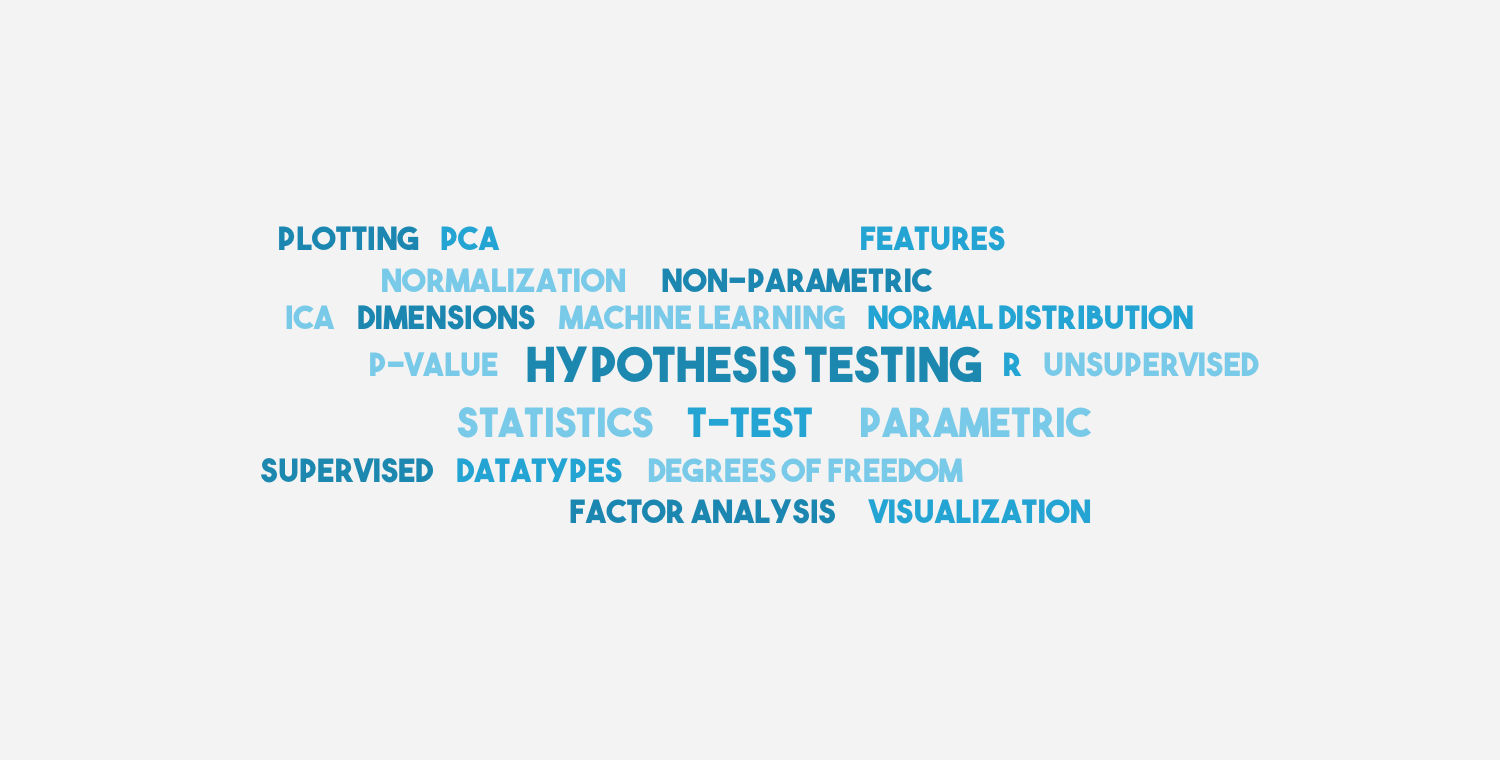
This time I am going to show you how to perform PCA and ICA. In the next one or two posts I will show you Factor Analysis and some scaling and projection methods. The idea for this mini-series was inspired by a Machine Learning (Unsupervised) lecture I had at university. I will perform all this … Continue reading [Dimensionality Reduction #1] Understanding PCA and ICA using R

![[Howto] Using Google URL builder, Google Analytics and R to create trackable QR codes](https://www.katzentante.at/wp-content/uploads/2015/10/qrcode_ga.png)

![[Dimensionality Reduction #1] Understanding PCA and ICA using R](https://www.katzentante.at/wp-content/uploads/2015/05/pca_ica.png)