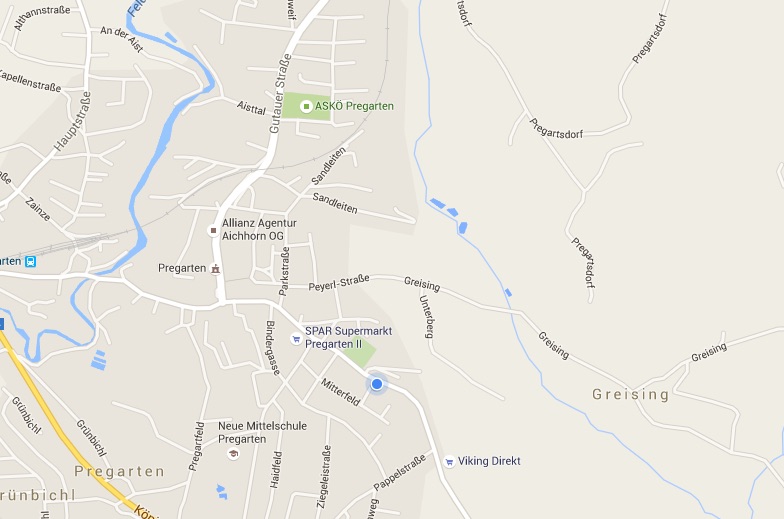
Da ich Karten und GPS Daten sehr interessant finde, bastle ich gerne Karten und füge sie z.B. hier auf meinen Blog ein. Prinzipiell fallen mir 3 Möglichkeiten ein, Karten in Blog Posts einzubinden. Zu jeder dieser 3 Arten stelle ich euch ein konkretes Beispiel vor und erkläre euch die Vor- und Nachteile. Externe Karten einbinden: … Continue reading Karten in Blog Posts einfügen
Tag: visualisation
Add non-overlapping labels to a plot using {wordcloud} in R
Several times when I create a plot I want to add labels for some dots directly on the plot. For this purpose I have looked for a solution to do this, because implementing it with text would probably take a lot of work. Luckily I found this two links: [stackoverflow] How do I avoid overlapping … Continue reading Add non-overlapping labels to a plot using {wordcloud} in R


